2025 has had quite the interesting start! With record amounts of snowfall in our area, everything seemed to grind to a halt for a few days, including the real estate market. The unexpected weather delays paired with slightly increased interest rates seemed sure to make for a slower January, but demand at the beach continues to remain strong. While some areas posted significant gains in total sales volume and average sale price, days on market increased in almost all of our local markets. Let’s examine how each area performed in January 2025 compared to January 2024.
Sussex County: A Broad Overview
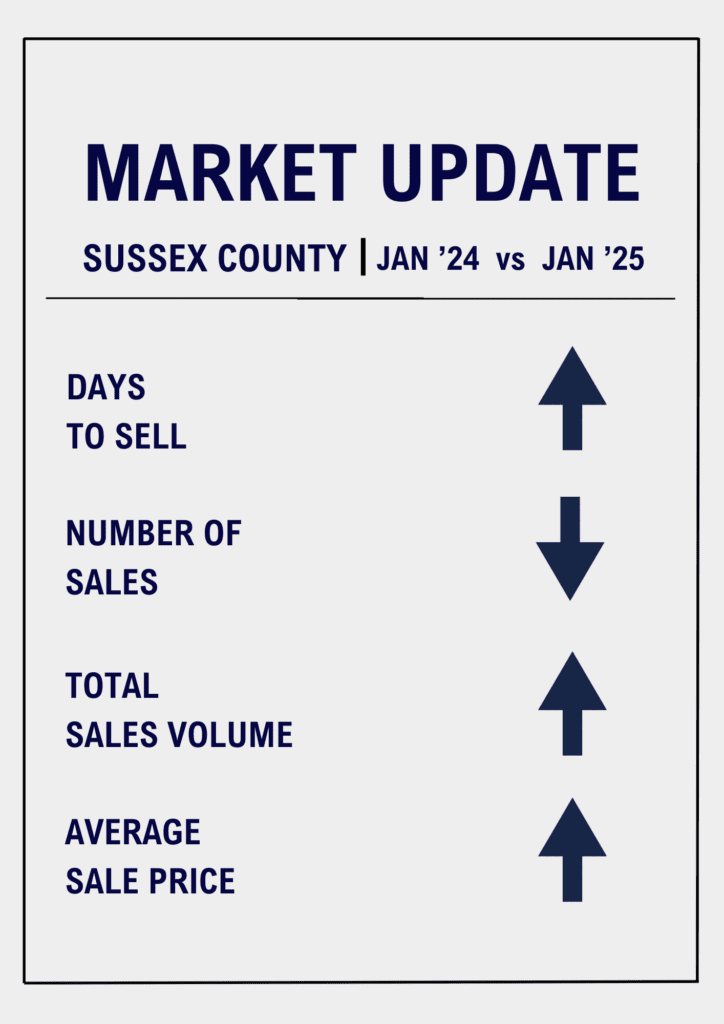
As a whole, the Sussex County market showed varied performance in January 2025:
- Days to Sell: The average time to sell a property increased slightly by 4 days, from 66 days in January 2024 to 70 days in 2025.
- Number of Sales: Sales activity decreased by 5%, with 396 transactions completed.
- Total Sales Volume: Despite the decrease in number of sales, total sales volume saw a significant rise, increasing by 12%.
- Average Sale Price: The average sale price also grew substantially by 16%, reaching $567,078.
These numbers reflect a market driven by high buyer interest, especially in premium properties. Despite longer days on the market, coastal towns remained competitive and attractive to buyers.
Town-by-Town Analysis
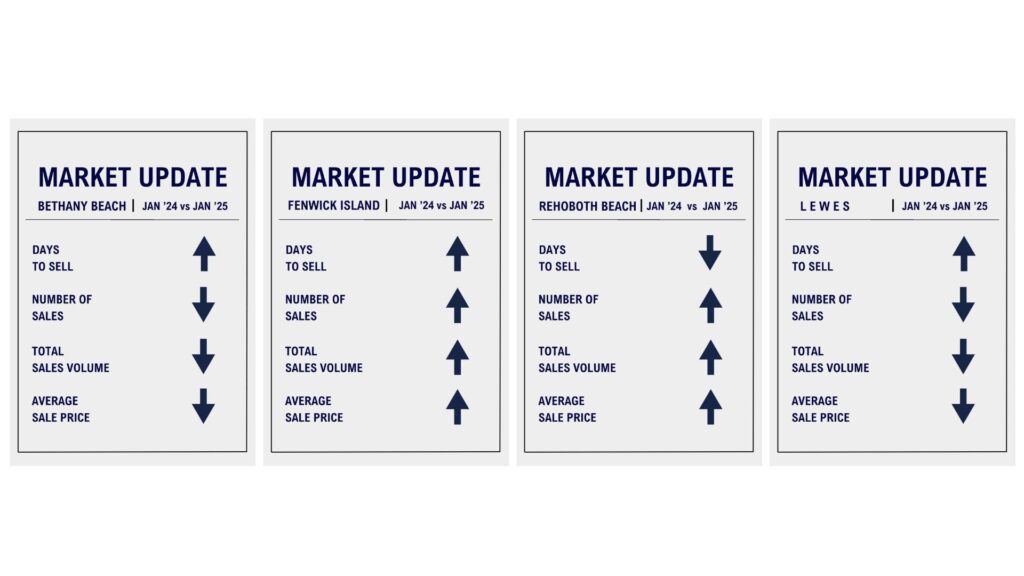
Bethany Beach
Bethany experienced a slightly slower month compared to January 2024, with just 2 fewer sales and a longer time to sell properties.
- Days to Sell: The average days on market increased by 22 days, from 51 in January 2024 to 73 days in 2025.
- Number of Sales: There were 2 less sales this year than last, with 7 transactions in January 2025.
- Total Sales Volume: With fewer transactions in 2025, it is expected that total sales volume would also decline, reaching $7,905,000.
- Average Sale Price: The average sale price decreased slightly, settling in at $1,129,286.
The longer time to sell and slightly fewer transactions can definitely be blamed on the weather, however, they also saw a higher concentration of sales in the lower-to-mid-range properties priced between $500k and $700k.
Fenwick Island
Market activity in Fenwick was off to a great start despite homes taking considerably longer to sell.
- Days to Sell: The average days on market increased from 12 in 2024 to 96 days in January 2025.
- Number of Sales: The number of sales doubled in 2025 with 2 transactions in 2025, compared to just 1 in 2024.
- Total Sales Volume: It is no surprise with more transactions, that the total sales volume also increased, reaching $4,287,500.
- Average Sale Price: The average sale price increased to $2,143,750!
Fenwick Island’s dramatic increase in both sales volume and average sale price is due to the fact that the only sale in January 2024 was a small condo, compared to 2 high end sales in 2025. This indicates strong demand for luxury homes in this quaint beach town. While the days to sell increased significantly, this metric should be viewed in context of the higher-value properties that typically require longer marketing periods to find the right buyer.
Rehoboth Beach
Rehoboth remains a sought-after market, with steady growth and increased sales activity.
- Days to Sell: The average time to sell a property decreased by 4 days, from 68 in January 2024 to 64 days in 2025.
- Number of Sales: Sales activity increased by 16%, totaling 50 transactions in January 2025.
- Total Sales Volume: Total sales volume grew by 83%, reaching $61,456,701!
- Average Sale Price: The average sale price increased by 52%, reaching $1,280,348.
Rehoboth continues to draw buyer demand, and no matter the weather, the prices continue to go up!
Lewes
Lewes experienced a slower January this year compared to last, primarily due to fewer sales in the luxury market.
- Days to Sell: The average time to sell a property increased by 15 days, from 55 in 2024 to 70 days in January 2025.
- Number of Sales: There were 14 less transactions in January 2025, with a total of 66 sales.
- Total Sales Volume: As expected with less sales, the total sales volume also decreased by 26%, reaching $32,729,295.
- Average Sale Price: The average sale price also decreased, settling at $511,395.
The decline in sales volume and average sale price is due solely to more condo sales and less single family homes selling in 2025 compared to 2024.
Key Takeaways
- Despite higher interest rates and weather delays, the county as a whole showed strong growth in both sales volume and prices.
- Days on market increased in most areas, suggesting weather slowed down the market this year.
Every neighborhood in Sussex County has its unique market dynamics and opportunities. Understanding these local trends is crucial for making informed real estate decisions. Let’s connect to discuss your real estate goals this year and how we can navigate this dynamic market together.